
Irrational Exuberance?
By: Aaron Anderson, CFP®, CFA, Managing Partner
December 30, 2025
On December 5, 1996, Fed Chair Alan Greenspan coined the phrase “irrational exuberance” which he apparently thought up in the bathtub. In his usual way[1], he was careful to not say that asset prices were too high, but posed it as a question: “How do we know when irrational exuberance has unduly escalated asset values, which then become subject to unexpected and prolonged contractions?”
What prompted his comment? In less than two years, the NASDAQ had almost doubled and the S&P 500 was up about 60%.
Of course, we know what happened in the following years. The market continued climbing for over three more years until the “dot com crash” of 2000 followed by 9/11 in 2001. As you can see though, despite one of the worst crashes in recent history, the market never got back to where it was when Greenspan made his irrational exuberance comment.
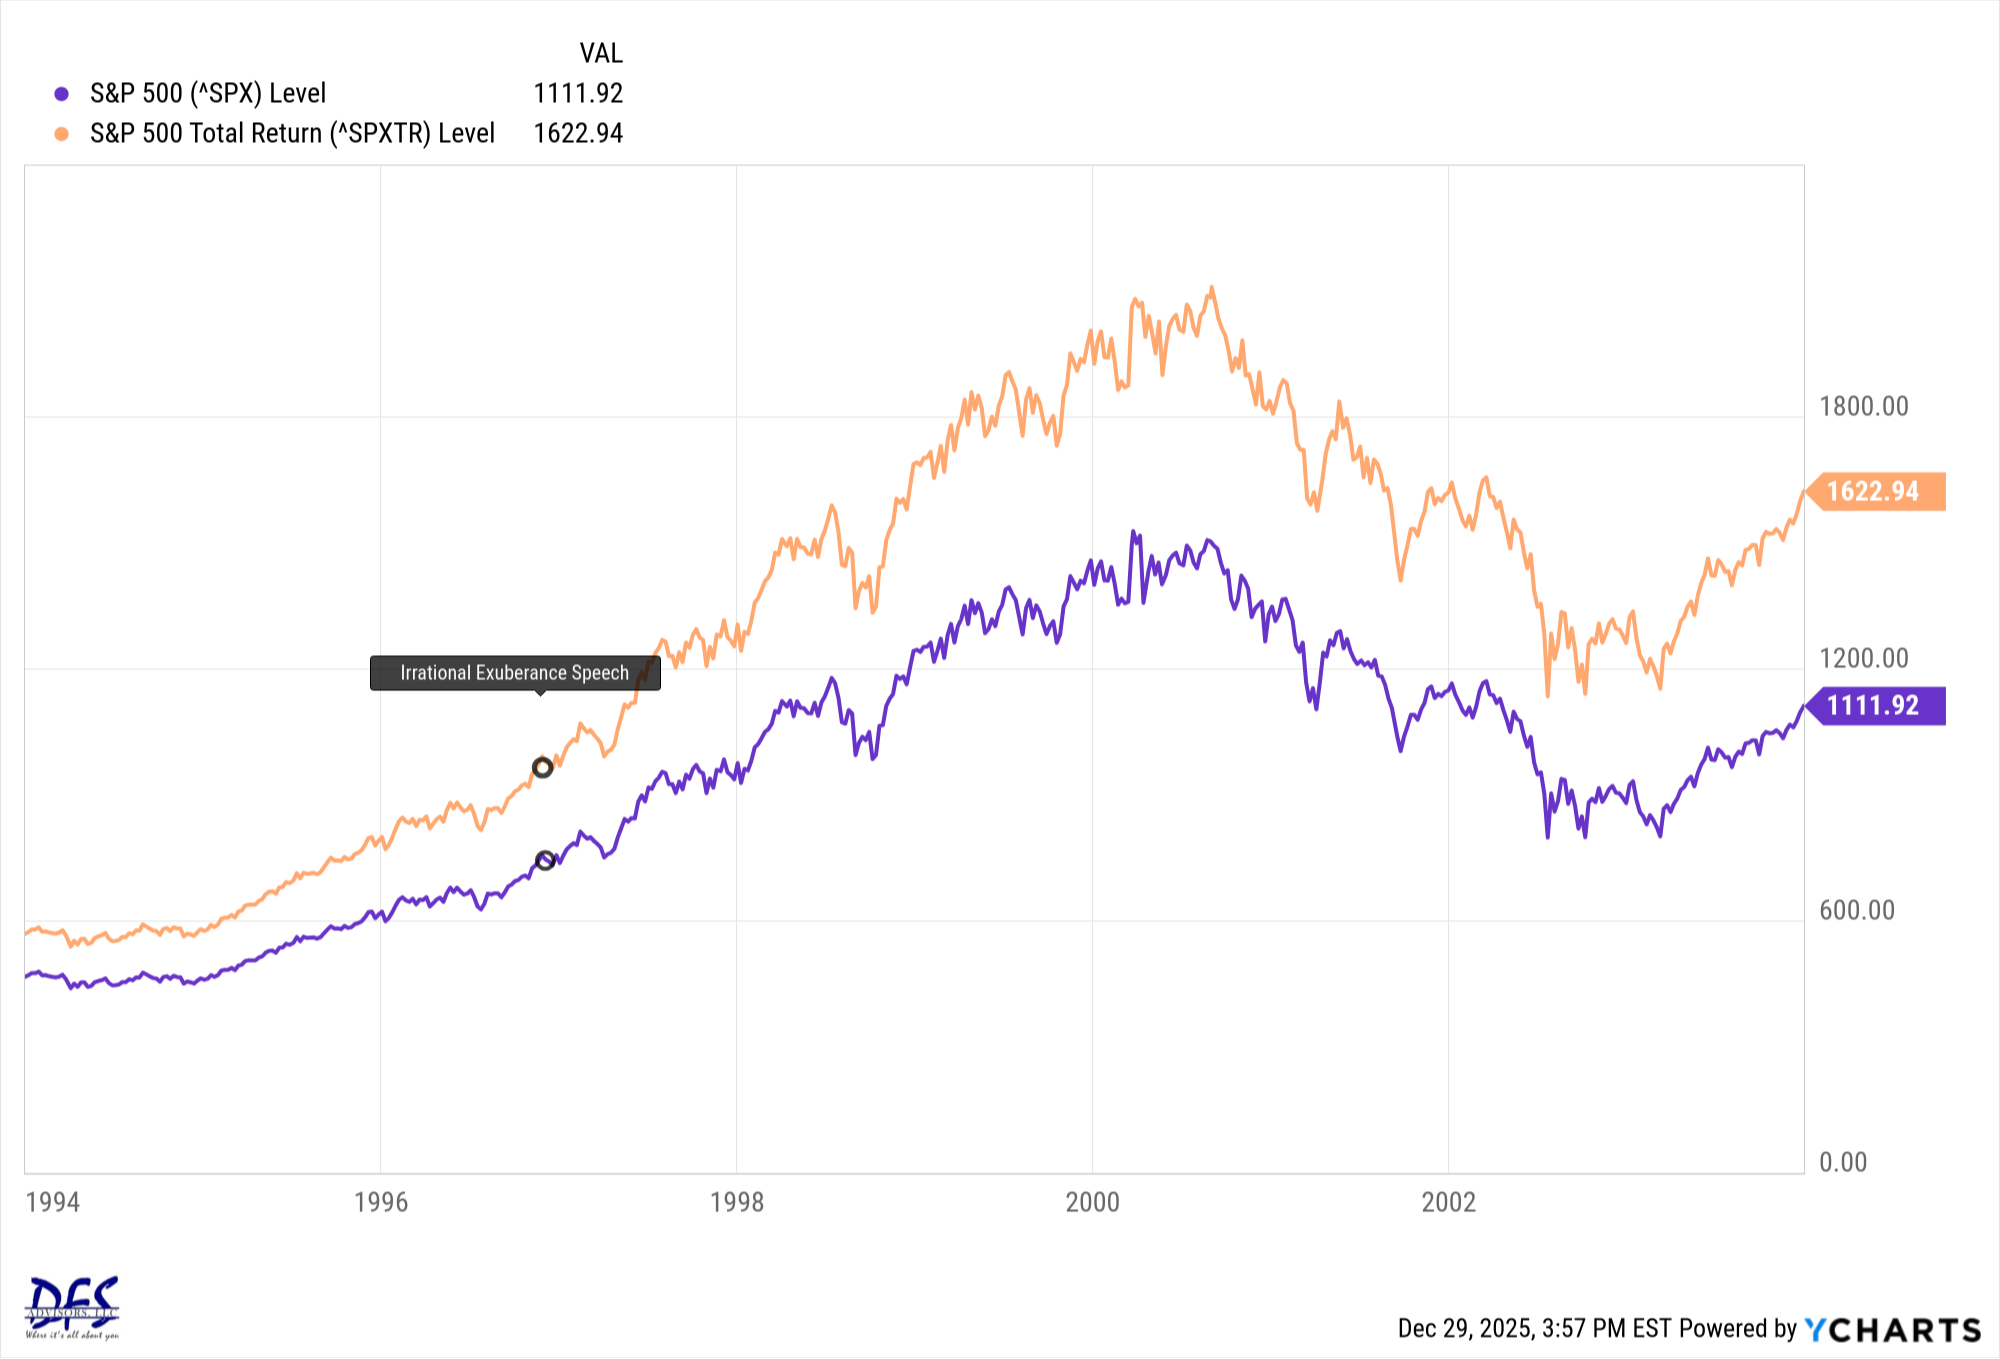
The S&P 500 index almost did (purple line) but if dividends are included (orange line), which would have been lost if stocks were sold, it never got close. Even though he might have been right looking at valuations, one of the smartest financial minds at the time missed what the market would do.
Anyone who sold their stock positions the day after his speech would have missed years of growth and dividends and might have even bought back in higher due to FOMO (fear of missing out) as the market kept going up. Or, maybe they stuck to their beliefs that the market was overpriced and patted themselves on the back while it fell. However, they would have then had to buy back in – while the news was dire – at levels higher than when Greenspan made the speech. Many missed out on future gains because they didn’t.
Why do I bring this up now? The market has had three above average years in a row. Could we be experiencing irrational exuberance all over again? Maybe – and the market could fall accordingly. Or, it could turn out like Greenspan’s time where it continues going up for a long time and never gets back down to these levels again when the next bear market does inevitably strike.
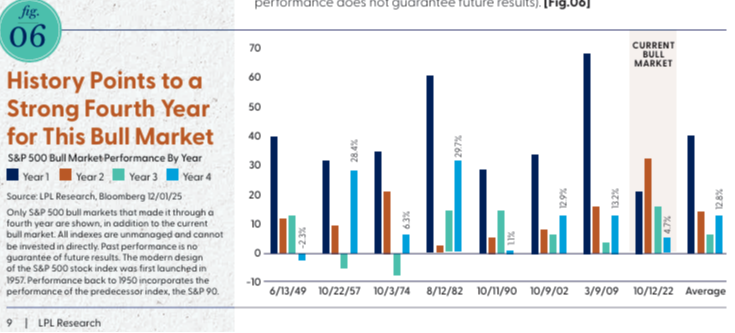
For the coming year, LPL Research presents the case in their “2026 Outlook” piece that the bull market could continue, fueled by AI spending and monetary easing by the Fed. While the entire piece is worth a read, I found Figure 06 on page nine especially interesting. While past performance does not guarantee future results, bull markets that last at least three years tend to do well in the fourth and the average advance is over five years.
Earnings have also been robust which can help support the bull market. According to Factset, in the most recent quarter, 86% of S&P 500 companies met or exceeded earnings estimates and 76% of companies met or exceeded revenues. The estimated year-over-year earnings growth rate is 8.3%; while this is lower than recent year averages, companies in general still expect earnings growth with a below average number expecting negative earnings growth.
So, while there are parallels to the late 90s, this bull market could have some legs as the saying goes. Remember though that this is a midterm election year and so between that, current high valuations, and yet another looming government shutdown if Congress can’t appropriate funds by January 30th, we might see more volatility with tempered gains relative to other years. LPL’s Chief Economist Jeffrey Roach does a good job of listing headwinds and tailwinds in a support article to the Outlook piece if you are interested in a deeper dive.
Please let me know if you have any questions or wish to discuss. But whatever the market ends up doing, I wish you a wonderful year!
[1] Greenspan once told a Senate Committee, “If I seem unduly clear to you, you must have misunderstood what I said.”
Content in this material is for informational purposes only and not intended to provide specific advice for recommendations for any individual. All performance referenced is historical and is no guarantee future results. All indices are unmanaged and may not be invested into directly.
The Standard & Poor's 500 Index is a capitalization weighed index of 500 stocks designed to measure performance of the broad domestic economy through changes in the aggregate market value of 500 stocks representing all major industries. The NASDAQ Composite Index measures all NASDAQ domestic and non-U.S. based common stocks listed on The NASDAQ Stock Market.
The economic forecasts set forth may not develop as predicted and there can be no guarantee that strategies promoted will be successful.
Stock investing includes risks, including fluctuating prices and loss of principal.