

A Correction is Coming … Eventually
By: Aaron Anderson, CFP®, CFA, Managing Partner
September 23, 2026
“Investing goes off track when you believe you are entitled to high returns because you did all the right things.” – Aswath Damodaran, Professor of Finance at Stern School of Business of NYU.
As I write this, the market is again at or near all time highs. This is despite not having resolved any of the reasons I mentioned in June that might cause volatility. The war with Iran is still in a tenuous ceasefire, inflation is still an issue with high gas prices, and we still don’t know which party will control Congress after elections in November.
When the market is near all-time highs, it’s good to remember that we will have a meaningful correction at some point in the future. In fact, most years have one even if the year ends on a positive note.
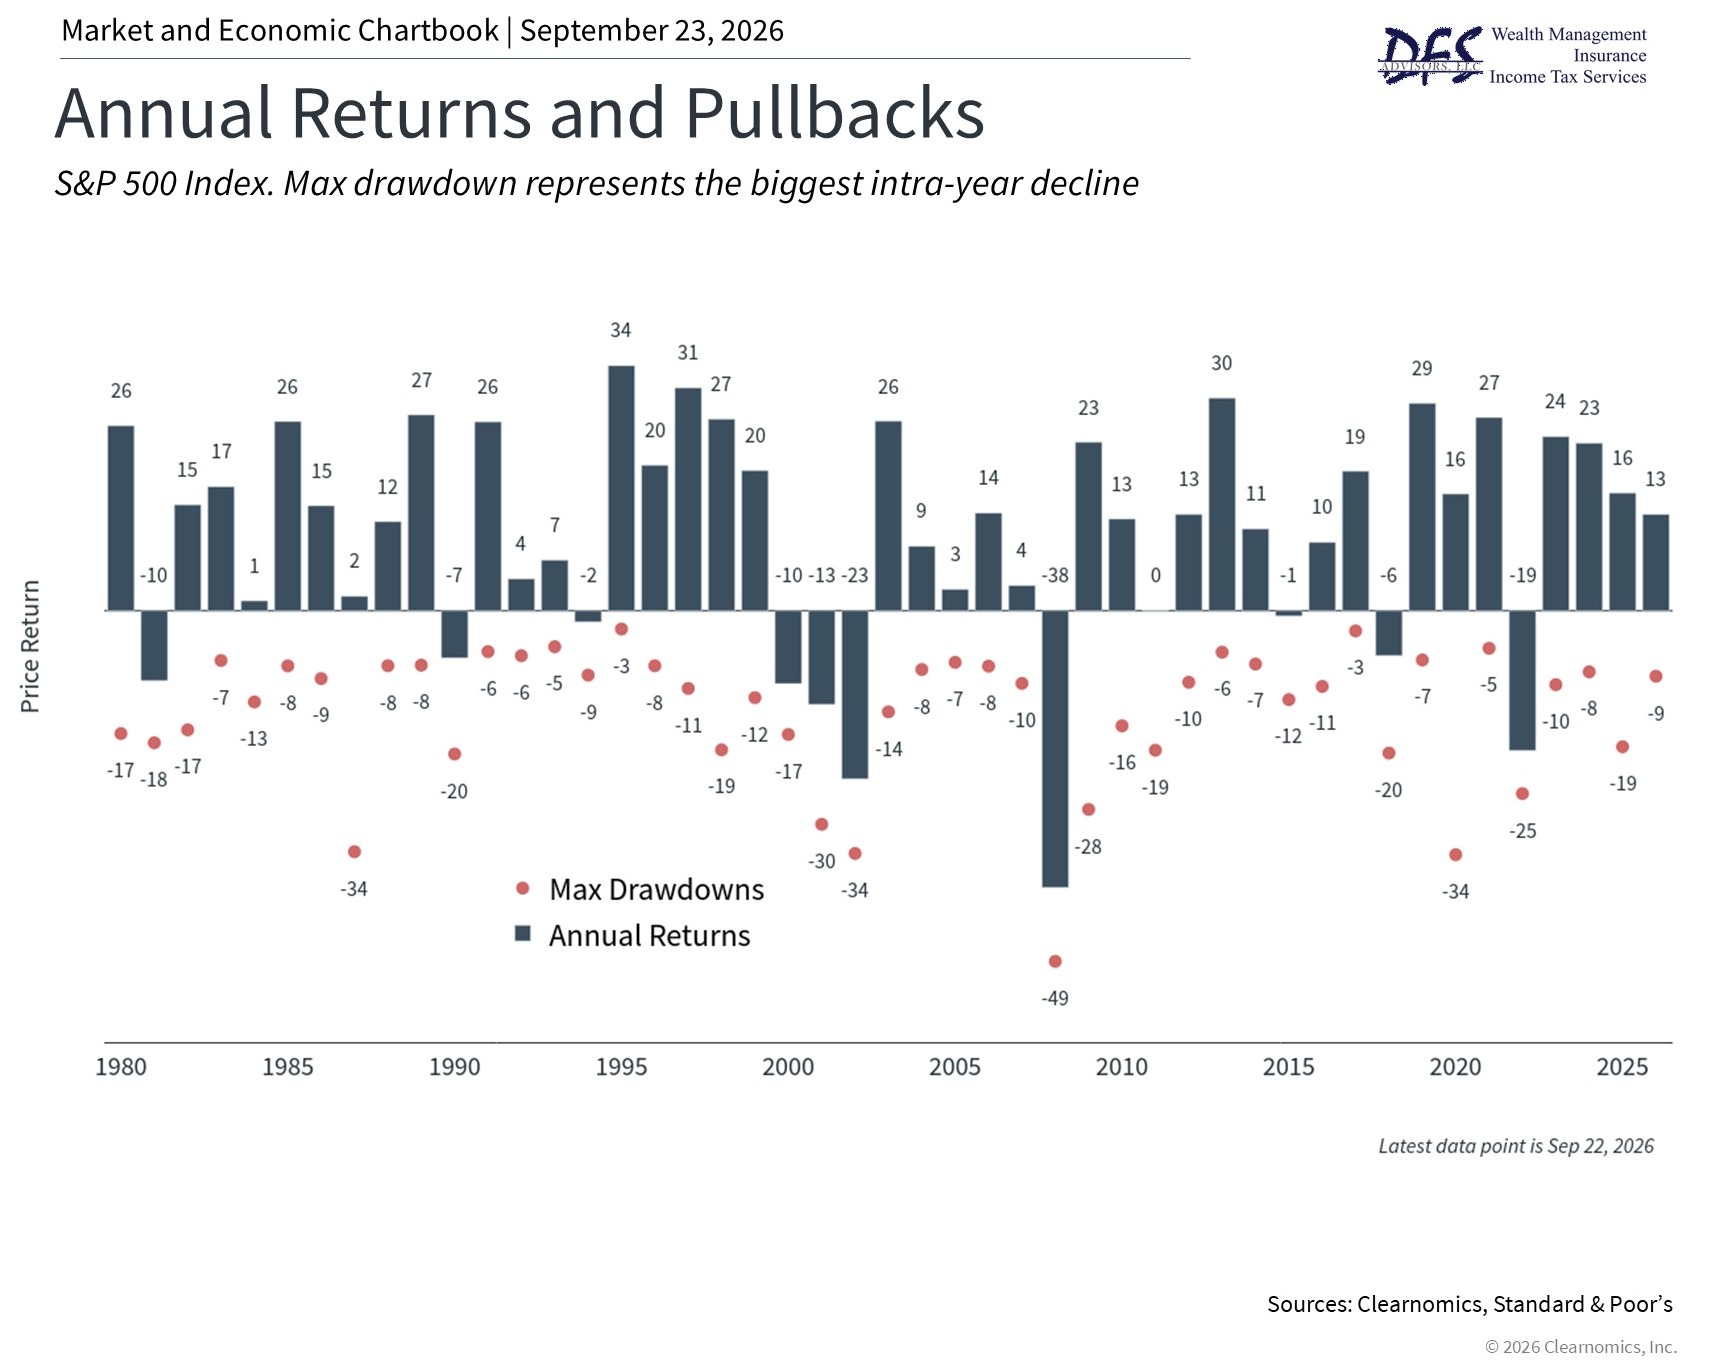
The problem is it’s anyone’s guess as to when the next one will be.

Mr. Grantham predicted the 2008 crash correctly but if you followed his advice over the last decade and a half, you’d have missed out. I didn’t include that to belittle him. He’s not the only smart investor that has been wrong about bubbles and expected routs in the market.
But history has shown that it will happen. It’s the cost of the outsized returns that the market has given in the past and is expected to give in the future.
If the market lost 30% over the next few months, we’d only be back to where we were in April of 2025. That surprised me! We’d only lose a year and a half worth of gains. The difficulty is the psychology of it. It feels much better hitting a number on the way up than on the way down. But we should prepare ourselves for the possibility.
The good news is that the average correction is only 14.3% which would only set the market back to about six months ago. Plus, we can take solace in the fact that the average recovery only takes four months.
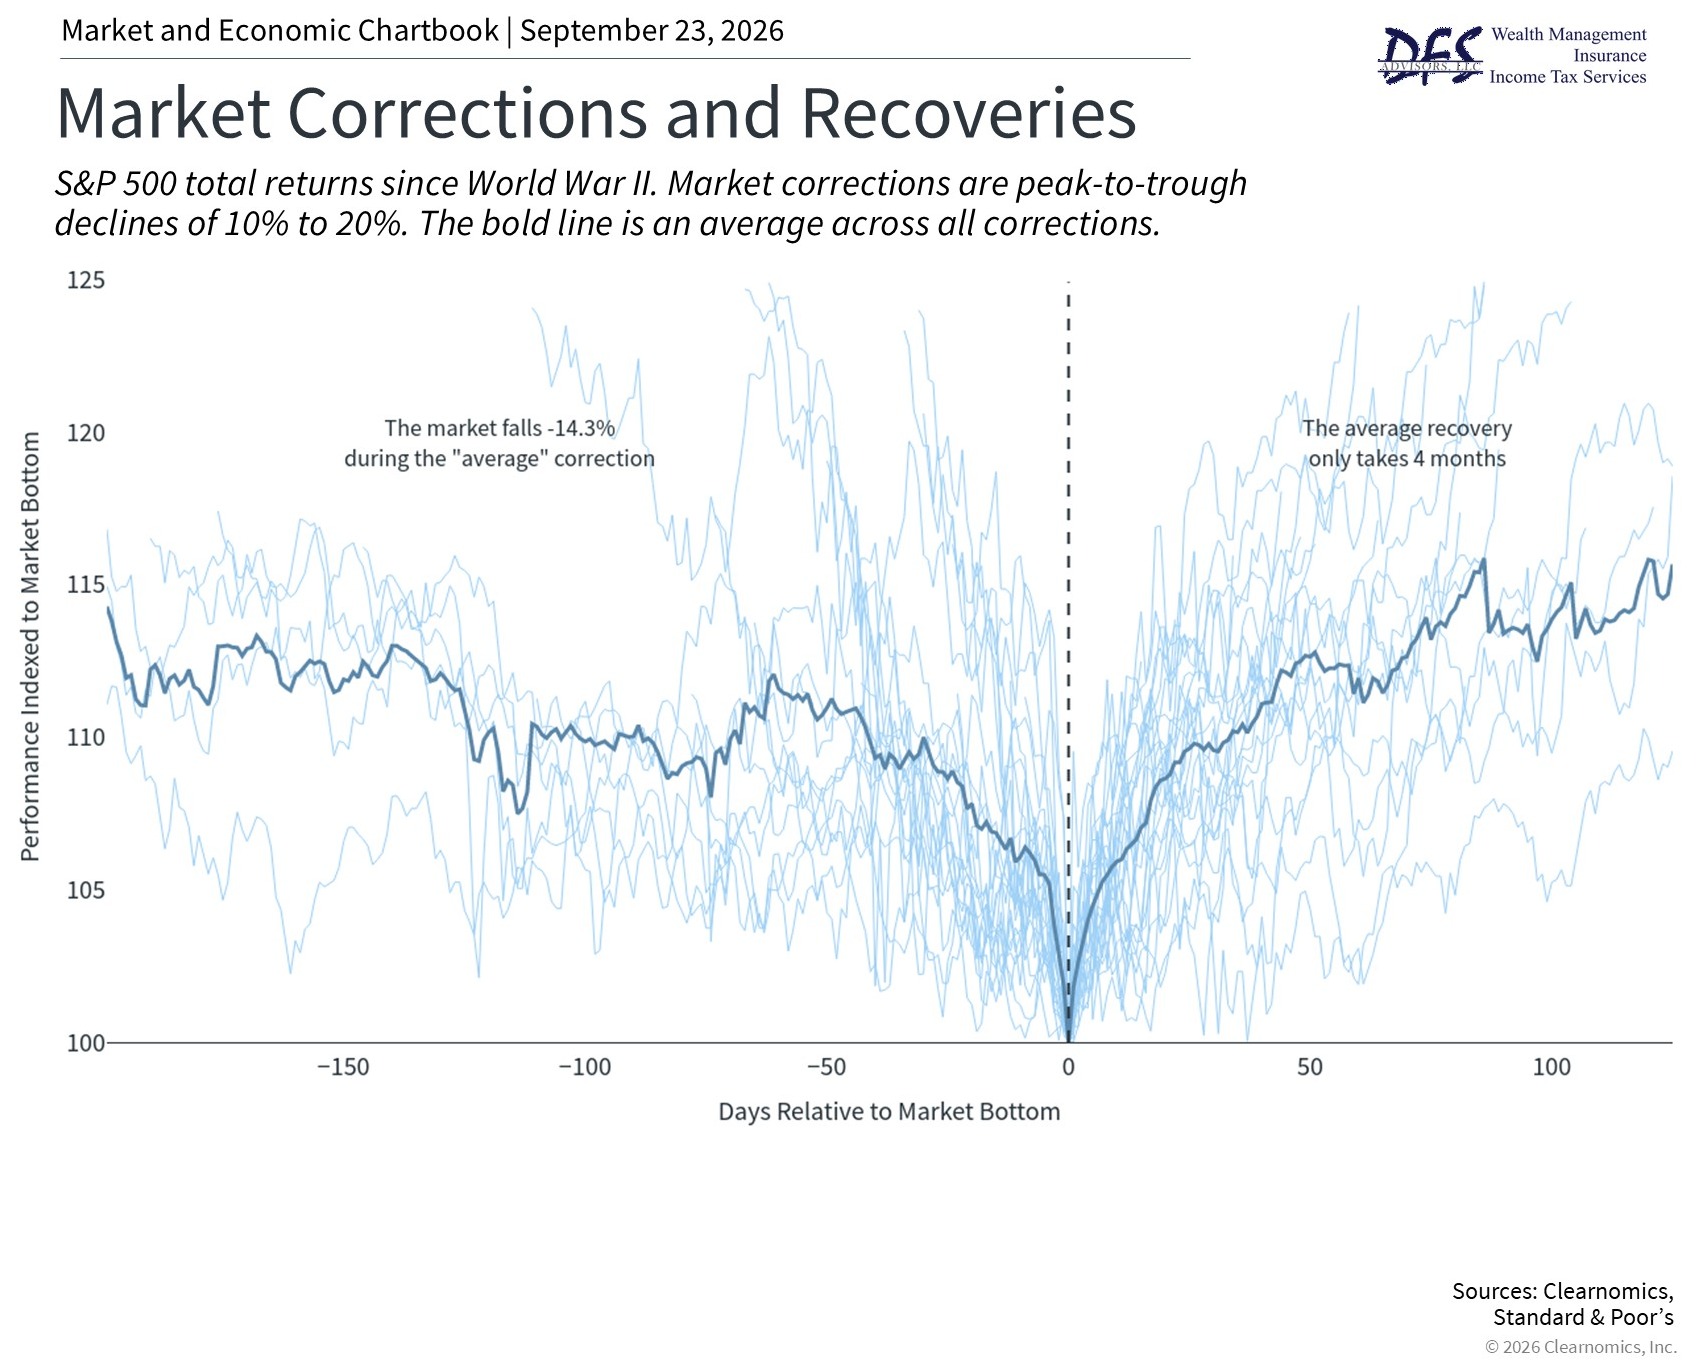
The word “average” is doing a lot of heavy lifting in those sentences. What about recessions that were worse like 2000 and 2008? Since 1957, the S&P 500 has only had six crashes of 30% or more. They took an average of 4.3 years to recover. The “dot com crash” of 2000 took 7.2 years to hit new all-time highs but the celebration didn’t last long because the “great financial crisis” of 2008 took added another 5.5 years. That’s why the 2000s are sometimes referred as the lost decade for the market.
As long term investors, had you let that experience keep you from investing, you’d have missed out on what has arguably been one of the best bull markets of all time.
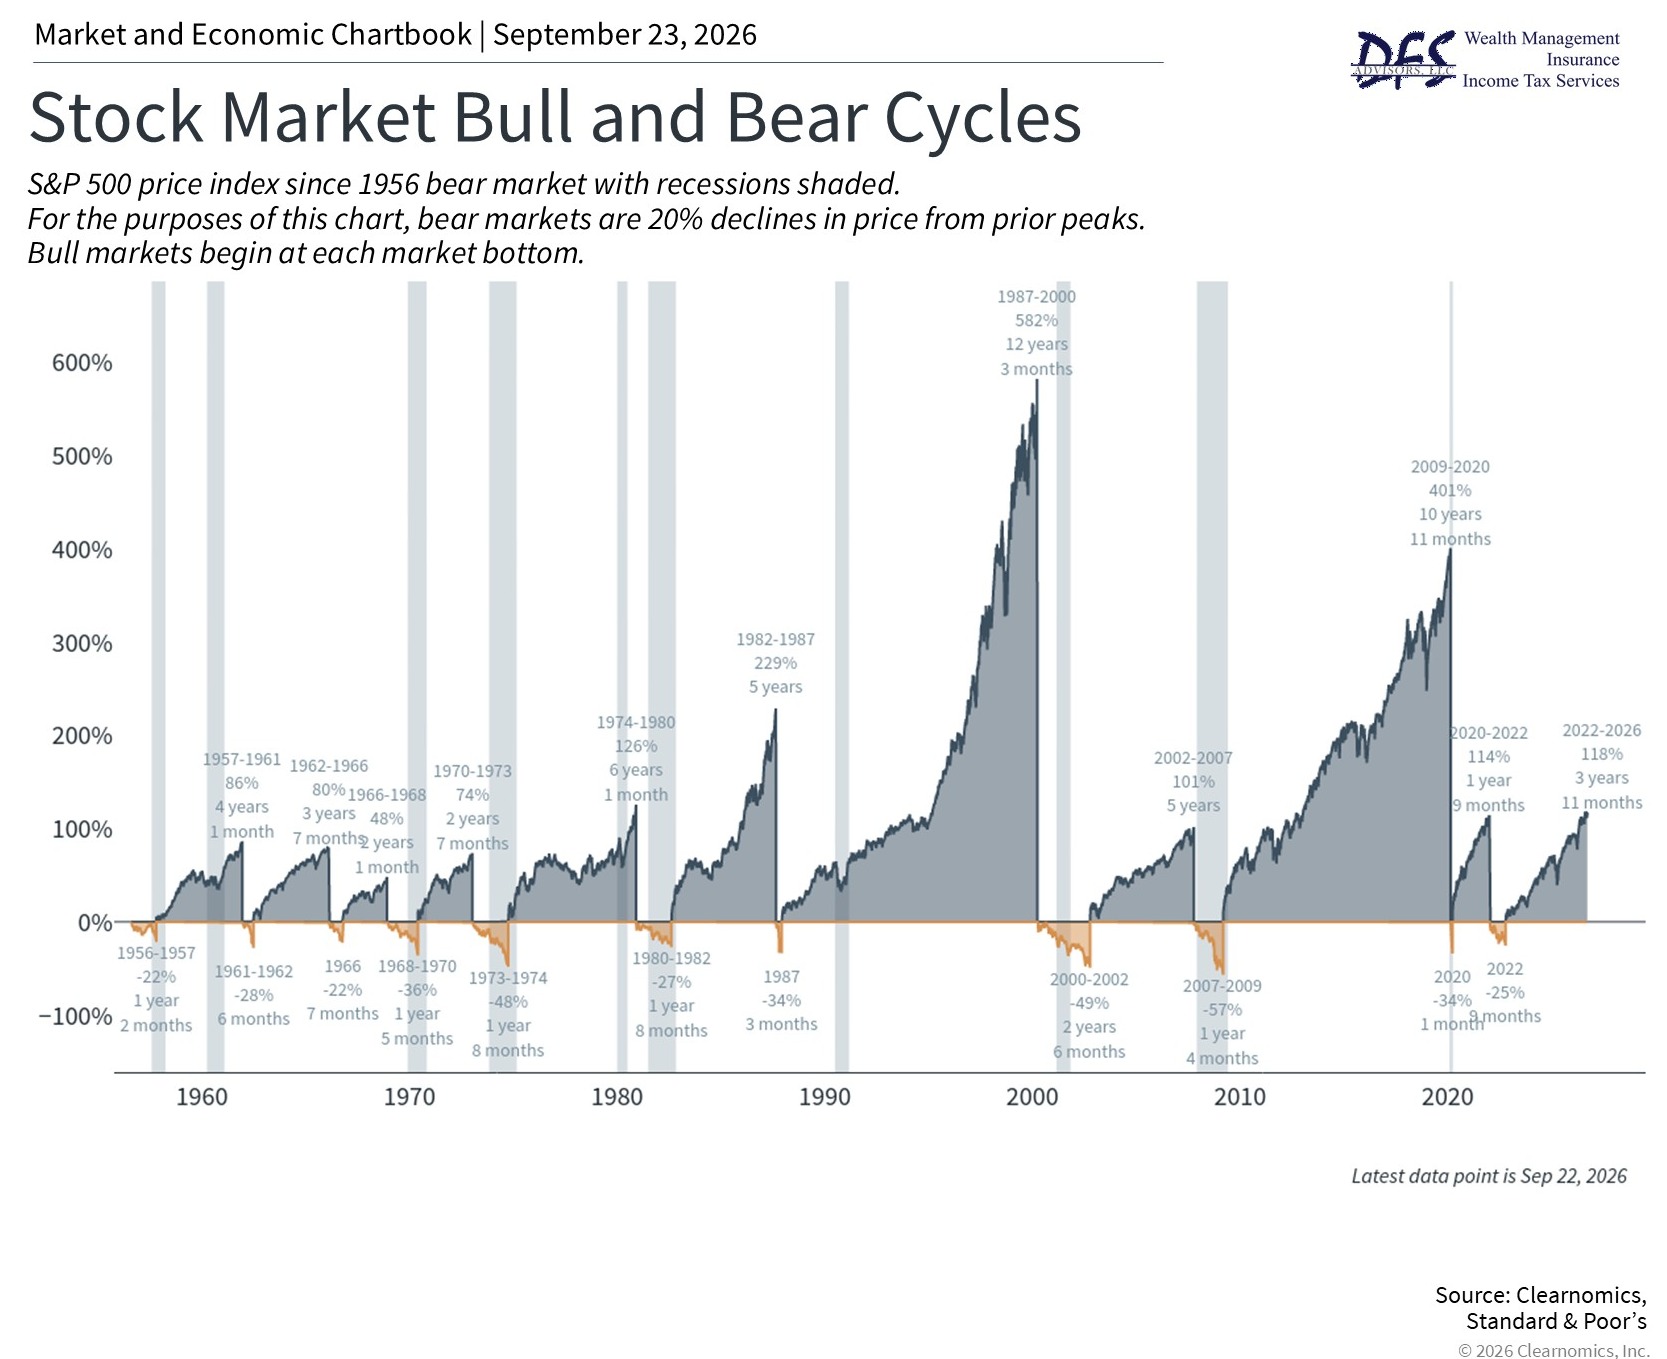
The market is up more often and when it’s up, it’s up a lot. It’s down a lot less often and for much shorter periods. Since the postive time periods are so much larger than the negative ones, the scaling of the graph hides the fact that those down years were substantial and hard to sit through. I don't mean to scare you, but just remind you of a possibility that we haven't had to deal with much over the last almost twenty years.
I want to end on a positive note. Pundits sometimes talk about us being in an “AI bubble” similar to the “dot com bubble” of the late 1990s. Max’s recent article addresses how earnings have been supporting recent valuations. Since he wrote that, I came across this chart that further supports his points.
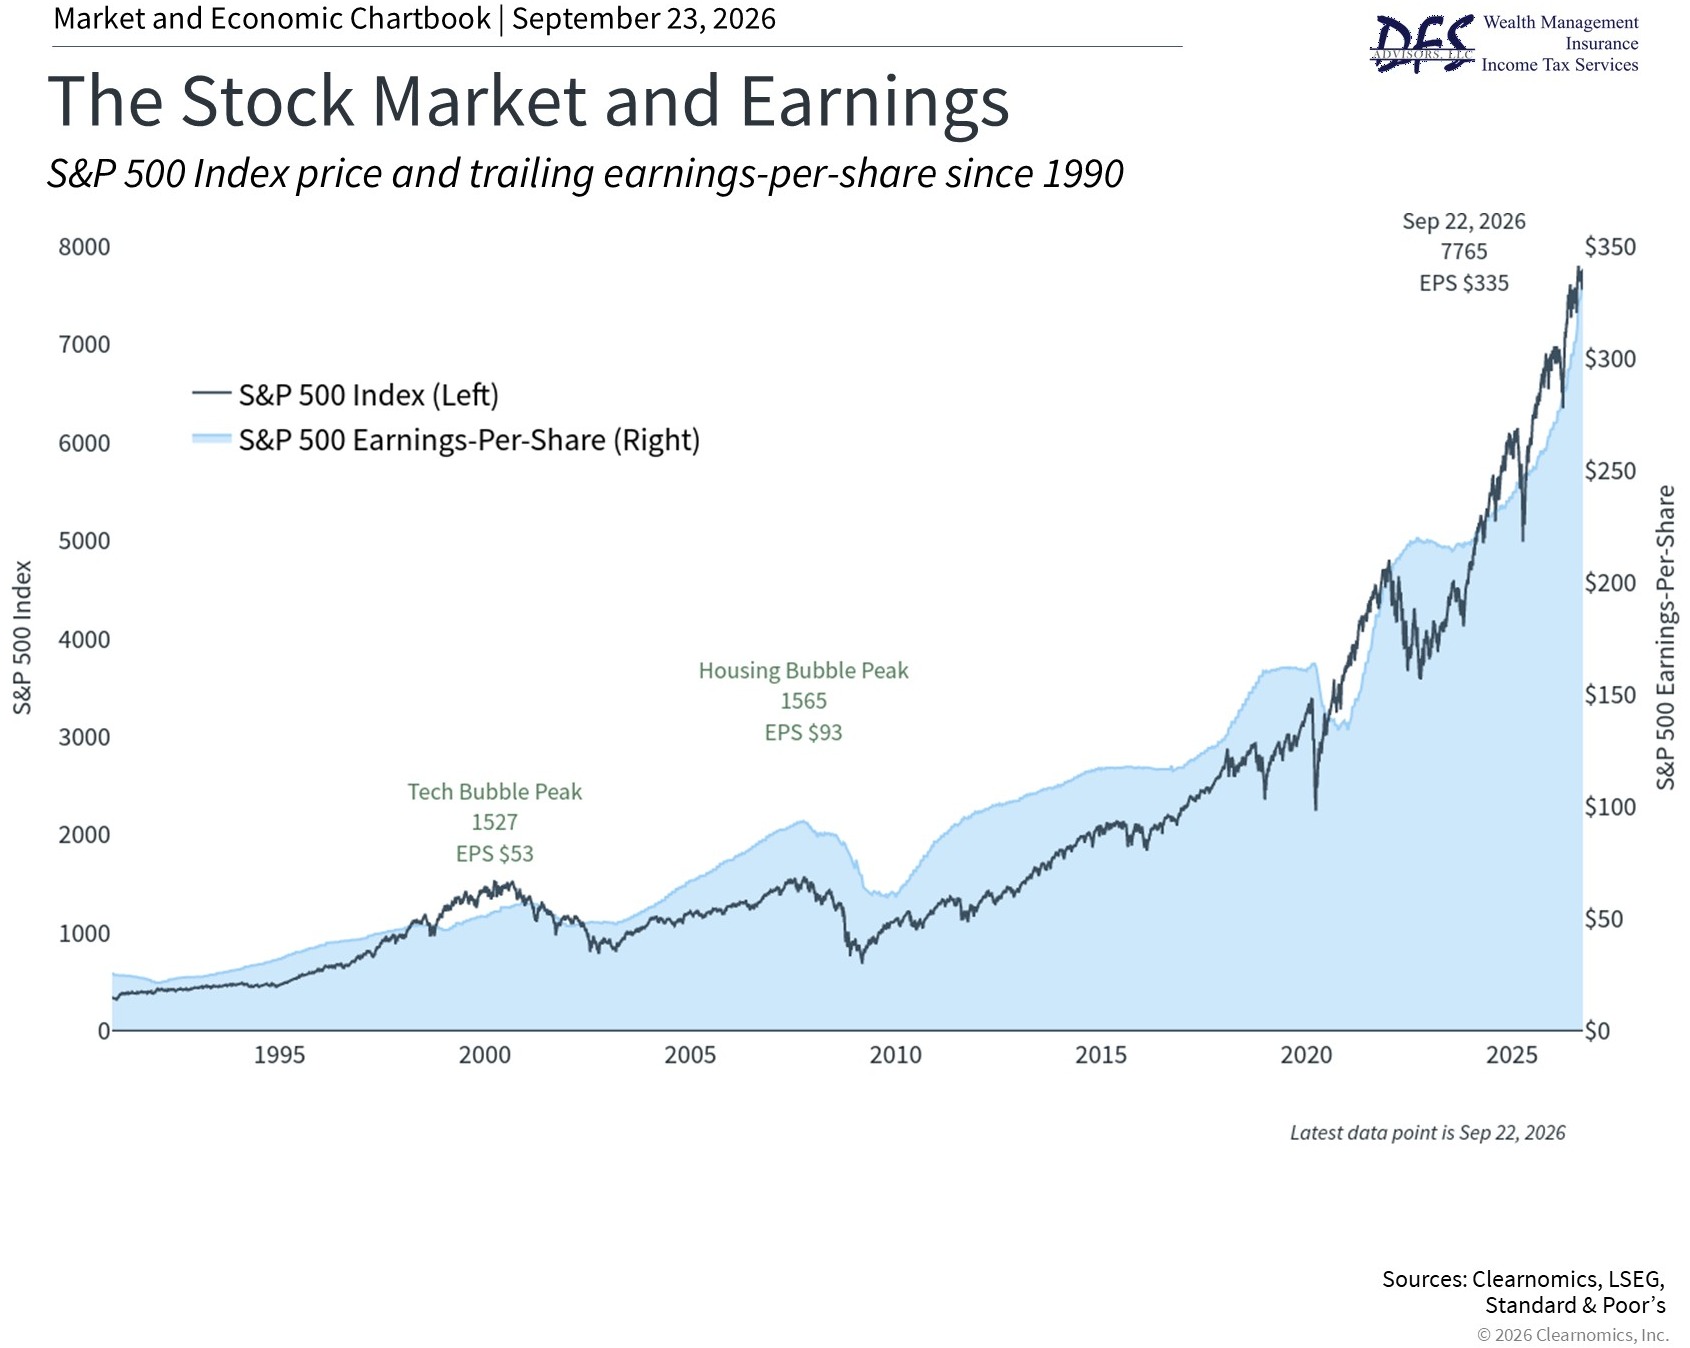
We can’t use charts like this as buy or sell signals because sometimes valuation and earnings can get disjointed. But what it does tell us is that the increase in valuations over the last decade plus have generally been supported by earnings growth.
Since I started with a quote from a well-known market pundit, I’d like to end with one:
“Far more money has been lost by investors preparing for corrections or trying to anticipate corrections than has been lost in the corrections themselves.” – Peter Lynch, Portfolio Manager, Magellan Fund
We know a correction is coming eventually and we should mentally prepare for it. Unfortunately, we don’t know when and so we stick to the plan.
Content in this material is for informational purposes only and not intended to provide specific advice for recommendations for any individual. All performance referenced is historical and is no guarantee future results. All indices are unmanaged and may not be invested into directly.
The Standard & Poor's 500 Index is a capitalization weighed index of 500 stocks designed to measure performance of the broad domestic economy through changes in the aggregate market value of 500 stocks representing all major industries. The NASDAQ Composite Index measures all NASDAQ domestic and non-U.S. based common stocks listed on The NASDAQ Stock Market.
The economic forecasts set forth may not develop as predicted and there can be no guarantee that strategies promoted will be successful.
Stock investing includes risks, including fluctuating prices and loss of principal.